New bootstrap analysis results
Timestamp:
Tags:
debian
I wrote a small wiki page for botch. It includes links to some hopefully useful resources like my FOSDEM 2013 talk or my master thesis about botch.
The final goal of botch is to generate a build order with which Debian can be bootstrapped from zero to more than 18000 source packages. But such a build order can only be generated once enough source packages (by now the number is around 70) incorporate build profiles which allow to compile them with less build dependencies and thereby break all build dependency cycles. So an intermediary goal of botch is, to find a “good” (i.e. a close to minimal amount) selection of such build dependencies that should be dropped from their source packages. So far, the results of all heuristics we use for this task were just dumped to standard output. Since this textual format was hard to read for a human developer and even worse machine readable, that tool now outputs its results in JSON. This data is then converted by another tool to a more human readable format. One such format is HTML and with the help of javascript for sortable and pageable tables, the data can then be presented without producing too much visual clutter (at least compared to the initial textual format).
Another advantage of HTML is, that the data can now easily be shared with other developers without them having to run botch or install any other program first. So without further ado, please find the result of running our heuristics on Debian Sid as of 2013-01-01 here: http://mister-muffin.de/bootstrap/stats/
Here is a screenshot of what you can expect (you can see part of the table of edges with most cycles through them):
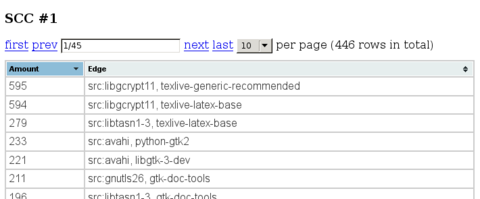
As a developer uses this information to add build profiles to source packages, this HTML page can be regenerated and will show which strongly connected components are now left in the graph and how to best make them acyclic as well.
Besides other improvements I also updated the data I used to generate the graphs from this post. I found this update to be necessary since we found and fixed several implementation bugs since October 2012, so this new plot should be more accurate. Here a graph which shows the amount of vertices in the biggest strongly connected component of Debian Sid by date.

Some datapoints are missing for dates for which important source packages in Sid were not compilable.